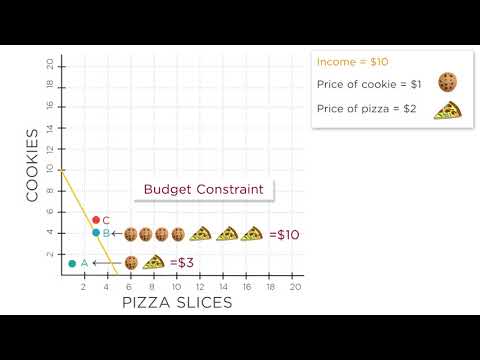
[0:00]Our goal in this part of the class is to figure out how you, as a consumer, make purchasing decisions in a marketplace. How do you decide what to buy each day? So far we've talked about your preferences and your utility. We studied what you'd consume if you won the lottery and had no limits. But that's not how real people make decisions. No one has infinite time or money. So if we want to predict exactly what people buy in the market, we'll also have to talk about their budgets. Today, we're going to write down an individual's budget constraint and depict it graphically. The budget constraint measures what you can afford to buy. For now, assume your budget is your income. That is, we'll assume that you'll spend whatever you make. By the way, that's actually true for most Americans. Most people live paycheck to paycheck. Later on, we'll talk about what happens when consumers can save and borrow. To make life easy for now, let's assume that you spend all your income on two goods, pizza and cookies. How do you allocate your income? That depends on how much income you have and the prices of each good. Let's set this up graphically. Let's say you have $10, that cookies cost $1 each, and that slices of pizza are $2 each. Now let's return to our graph that showed the decision between pizza and cookies. On the horizontal axis, we have the number of pizza slices. This point here means buying one pizza slice. This point means buying two pizza slices and so on. On the vertical axis, we have the number of cookies. So this point is one cookie, this point is two cookies, and so on. What happens if you spend all your money on pizza at $2 per slice? If you have $10, that means that you can buy five slices and will have nothing left over to buy cookies. That puts you at this point here, five slices and zero cookies. What happens if you spend all your money on cookies at $1 per cookie? If you have $10, that means you can buy 10 cookies and will have nothing left over to buy pizza. That puts you at this point here, 10 cookies and zero slices of pizza. Of course, you can mix and match too. You could get one slice of pizza for $2, and then have $8 left over to buy eight cookies. That puts you at this point here, eight cookies and one slice of pizza. You could get two slices of pizza for $4 total, and then have $6 left over to buy six cookies. That puts you at this point here, six cookies and two slices of pizza. Notice that these dots all fall on a diagonal line that goes from the top left to the bottom right. That's because if you want more pizza, you have to move to the right. But you're already spending all your money, so you have to give up some cookies and so you'll have to move down. Finally, in economics, we usually assume you can get a fraction of a cookie and a fraction of a slice of pizza, which means we can connect the dots. Let's take a step back now. We've drawn a line that represents your budget constraint. It shows all the bundles of goods you can get, every combination of cookies and pizza that exhausts your entire income. This graph is convenient because it also very clearly shows what you can and can't afford. Take a look at points A, B and C. Point A represents getting one cookie and one slice of pizza. It's inside the budget constraint line. Point B represents getting four cookies and three slices of pizza. It's right on the budget line. Point C represents getting five cookies and three slices of pizza. It's outside the budget line. Which of these points is unaffordable? That's point C. Point C is five cookies and three pizza slices, which costs $11, which is more than your $10 budget. Any point beyond the budget line is something you don't have the money to buy. Which points are affordable? Point A and point B are both affordable. But point A leaves you with money left over, whereas point B means that you spent your entire income. So here's a quick question. Assume you can't save any money. If you don't spend it today, it disappears. Would you ever get a combination like point A instead of a combination like point B? That is, would you ever choose a bundle that doesn't involve spending all your money? No, you wouldn't. Remember, we assume that more is always better. If someone offers you a cookie, you may as well take it. And since we assumed just now that you can't save money, you may as well spend it on something, assuming you can't eat your dollar bills. The budget constraint graph is also nice because it illustrates our old friend tradeoffs. So for example, start at point B with three slices of pizza and four cookies. Now you decide you're still hungry for something savory. You want more pizza. How do you get that? Well, you have to spend more on pizza, but your budget is fixed. So if you spend more on pizza, you'll have to spend less on cookies. That is where back to our friend opportunity cost. The opportunity cost of getting more pizza is getting fewer cookies. How many fewer? That depends on the price of each good. In our example, one slice of pizza costs twice as much as one cookie. So to get one more slice of pizza, you have to give up two cookies. The opportunity cost of one slice of pizza in this example is two cookies. This opportunity cost is represented by the price ratio. Suppose that the price of pizza is X. Suppose the price of cookies is Y. Then to get one more pizza, you need to give up X over Y cookies. In this case, the price of pizza is $2 and the price of cookies is $1. So to get one more pizza, you need to give up $2 over $1 equals two cookies. By the way, as we go up and down the budget line, we talk about giving up cookies for pizza and vice versa. Clearly, in reality, this isn't what's going on. You don't go to into a store and trade cookies for pizza. But the key point is that of opportunity cost. When you buy a slice of pizza, given a fixed budget, you forego the opportunity to eat two cookies. So it's like a trade.
1.6 Budget Constraints
AP Microeconomics with MIT Professor Jon Gruber
6m 24s1,127 words~6 min read
YouTube auto captions
Transcript source
YouTube auto captions
This transcript was extracted from YouTube's auto-generated caption track. The transcript below is server-rendered so it can be read, searched, cited, and shared without opening the original YouTube player.
Pull quotes
[0:00]Our goal in this part of the class is to figure out how you, as a consumer, make purchasing decisions in a marketplace.
[0:00]So if we want to predict exactly what people buy in the market, we'll also have to talk about their budgets.
[0:00]Today, we're going to write down an individual's budget constraint and depict it graphically.
[0:00]To make life easy for now, let's assume that you spend all your income on two goods, pizza and cookies.
Use this transcript
Related transcript hubs
Watch on YouTube
Share
MORE TRANSCRIPTS


