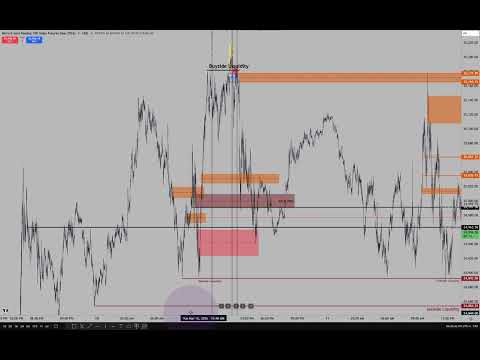
[0:02]Hello folks, how are you? Welcome back. Hope you're having a wonderful day. I am being blessed with such wonderful weather here locally and just a carnival-like atmosphere on my Twitter account today. So anyway, uh we're going to take a quick look at today. Uh today was CPI and earlier this morning I was counseling you all to try to avoid becoming insolvent, trying to predict what the CPI was going to do beforehand. It's always beneficial for to try to run, let it take off and whatever it does, going, moving higher or lower. Uh we can then usually fade that type of thing. Uh it can be a two-stage delivery, kind of like an FOMC. The only problem is is if it's part of a trending run, that two-stage won't be there. It'll just keep going and it'll be a day where it's just one-sided. And unless you were in it ahead of time, which is always a gamble, you probably don't get to participate in that. Okay, so because we're in a range-bound environment, uh today was a pretty, pretty easy trade after CPI and after we got into 10:00. Okay, so you had to wait, give it a little bit of time. And I'll go over some of the things, but I want to counsel you to go look at yesterday's lunch time period, and I taught this in my mentorship here. If you look at the vertical line here, that's 10:00 in the morning, Eastern Time, yesterday. And 1:30 PM, Eastern Time, yesterday. So New York lunch is a 2-hour window of time. We had relative equal highs here in the afternoon going into 1:30 when New York lunch ends. And then the opening range for PM session begins until 2:00 Eastern Time. That's what this is here, okay? But I want you to take a look at how this buy side was taken ahead of the 1:30 close on New York Lunch. That's not random. Okay, so this run on buy side liquidity, prior to that happening, go right into this candlestick right there. That is a buy-side on balance, sell-side inefficiency, right before the liquidity was taken during New York Lunch. So this is an algorithmic price delivery, it's not buying pressure. Just as much as it's not selling pressure that drove it down. This individual candlestick, now look at the data up here, okay? We're going to be looking at the closing price, which is this right there on this candlestick. Notice that price. 25,165.75. The next candlestick's open needs to be higher of a close. I'm sorry, higher, higher opening price rather than this candlestick's close, which is 25,165.34. And that's what you see the anchored to, okay?
[4:01]The candlestick low here 25,177 and a half. So that is your buy-side on balance, sell-side inefficiency with a volume imbalance at the low, okay? So here, if this was bullish, one would expect it to trade down into it and go higher. Not at this time of day. It's going to go back and seek liquidity. What liquidity? What's it going to look for? You got to go back and consider at 10:00. You start going through, here's the sell-side liquidity pool, there's a sell-side liquidity pool and it's part of first present to their value gap, which is that darker red line and you have this as well. Okay, so you have several factors where you can use the retracement lower in PM session. Between these two vertical lines, that is the opening range for PM trading in in the seas. 1:30 Eastern Time to 2 PM Eastern Time. First present there, fair value gap here. Displacement, trades up into it. There you go. First present there, fair value gap. Shorting hits it here.
[5:27]This buy-side and balance, sell-side inefficiency is now changing its characteristic to inversion fair value gap. Drives aggressively into first present there, fair value gap. Look at the bodies respecting that. It's probably random. Trades up into consequent encroachment. Of this city with the volume and balance midpoint, body's respecting it consequent encroachment, trades lower down into regular trading hours opening range gap. Low for yesterday. Let's see if it's trading there. Look at that reaction there. And then trades down into this inefficiency, I told you it would we would see it act as an inversion. And beautiful delivery to consequent encroachment and then sends it up into inefficiency there. And we go into new, start of new day with electron trading hours. So now what I'm going to do is I'm going to take this here, and I'm going to extend it to the right. Okay, so mind the price levels here. 25,177.5. 25,165.75. It's part of this lunch time reversal. So we're not looking at a classic, here's an old high that's put a line on it that so support resistance. Here's a classic high, let's put up trend line on it and call it resistance. That's not what we're doing here, okay? We're not doing it with that high. We're doing it with the inefficiency that sets the tone for a reversal at the time of the New York lunch closing. Everything in here sets the stage for revisiting these specific PD arrays. This one here, it starts with a buy-side, it turns to an inversion, fair value gap. So price trading up to this is a reason to anticipate lower prices. So now we're going to go in move forward in time. You see what price did overnight, using yesterday's opening range gap on regular trading hours.
[7:54]And then at 8:30, we had CPI, which was kind of wonky. Trades down into this old order flow there. Price back inside of Tuesday's regular trading hours, opening range gap. I told you to monitor that today and also keep your eye on 24,892 sell side. Okay, so price trades up here. There's that inefficiency from yesterday's lunch, New York lunch 2-hour window before the buy side was tagged and and rated. There's the two price points I told you to be mindful of. And it runs up into it, look at the body stop right here, and then it opens, trades just a little bit outside of it and then collapses. That's a wonderful opportunity to get in sync with the market on a complex reversal, okay? So it's very scary to take these trades when you don't know what you're doing. And I'm not trying to advocate that you should be doing it, I'm just showcasing prowess, skill, foresight, the idea of knowing what it's likely to do. Because I've come out here before many times and I've said, when I was doing just forex education, I I know where the high and lows are. Okay? And I know it sounded, it sounded crazy, but I've done it many times. I've done it with executions, I've done it with demo accounts, live accounts. I've done it with paper trading, I've done it with tape reading, I've done it with analysis that eventually comes to fruition the next day, the next several days. Okay? Week after week, it was like this for years. And I I kind of like want to bring something to light, because I said I would teach something. Uh yesterday I was in the trade around up. One of the charter members, students that I have asked if I would be teaching a new PD array. And I said I'd be releasing two of them this year. And one of them is this one here. When you're utilizing the 2-hour lunch window, previous day, if you have a reversal after liquidity has been taken, you take that inefficiency right before it takes the liquidity, carry that forward into the next day. If it trades up into it, it can set the tone for a shorting opportunity. Reverse it if we're going long. Now, let's look at the the mechanics of what the price action was doing leading up to this. CPI number, back and forth, okay? And then we went a little bit lower, the 24,892 and a half level didn't get traded to here. Came up into Tuesday's regular trading hours, opening range gap. I do not have today's opening range annotated. I did not need it. Using just yesterday's opening range gap is sufficient enough and this is the consequent encroachment level of that or midpoint. So look at the bodies respecting it here and here. You don't think there's no algorithm? Trades up, hits the high of here, creates a buy-side on balance, sell-side inefficiency, which will later become an inversion, fair value gap on my phone. I had these drawn as two lines, okay? But for the purpose of making it much more prominent on the recording here, I changed it to a rectangle so that way you can see it a little bit better. It was real thin lines and if you look at the posts I did on X, you'll see that these were just simply too thin. Uh trend line rates, and these are the two darker ones that were in the video. Then we have another buy-side on balance, sell-side inefficiency that should act as inversion as well. Why? Because it's going to go up here, this short-term high forms right at 9:42. And now we're going to be entering that gap here, which is going to offer discount sensitivity first. Hits it here, rallies, comes back up into this buy-side on balance, sell-side inefficiency. So this is reclaimed bullish fair value gap there. This one here also nests together and you have an inversion fair value gap between here. So that's a very, very short one. That's why you got that big pop there. Okay? Price runs right up into my level. What I'm looking for. And it's above this high here, so we have turtle soup scenario. Nobody, nobody, okay? Nobody was picking this price. Okay? I can say that because I'm Mr Nobody. Price trades into it here, and then sells off. Now this little area right in here, I had on a lower time frame, it's an inversion, fair value gap. I'm not going to change the chart here, because I want to keep my notes on the lower time frames to remain to what I want to use for tomorrow. But this is anchored to smaller time frame, sub 1 minute. If you were using it on this 1-minute time frame, you would just be simply anchoring it to this candlestick's high to that candlestick's low, and you'd still be fine. Okay? But I'm using a very small time frame model and it afforded me the idea of looking for this and then when it traded up here. And you'll see how I'll show you the executions in a moment. But this is inversion, fair value gap. Now I went short again, added pyramiding it. And then price meandered back down into yesterday, Tuesday's regular trading hours, opening range gap. Now the draw was 24,892 even. Go look at the tweet. Look what I posted this morning on X. This was those relatively equal lows that we were watching that I told you in yesterday's stream that it would not go below. And it didn't. Here it only went down below this. Look at the low right here. You're going to look at the low price right up here. Upper or left hand corner where my mouse is pointing, that's the low. If you look at that candlestick right there. 24,892 even. So it went just two ticks below the level that was defined from yesterday's pre-market session. So before 9:00 in the morning Eastern Time. So that was the the liquidity. I had to leave the house for a little bit and unfortunately I couldn't manage the trade and I I wanted to do something like this. If you look a little bit lower, there's this liquidity pool down here. No, I scratch it out so you can see it right there. That's that low there. I was going to try to aim for that.
[15:18]But I wanted to first see if it could get down into the event horizon. So let me let me give you an illustration of what event horizon is. Again, this is not something anyone has in their books. Okay? No one taught this stuff. I didn't learn it from anybody on this planet, okay? So here's 892 half, so we're going to anchor it to 892 half, drag down to 54.25.
[15:59]And I have it set just to show the 50% level, so that's event horizon. Okay, so it's the middle point between two pools of liquidity. So when it was trading here, I I could have very easily closed the trade and been, yay, look how smart I am. Okay? But I wanted to stay with it, but I had an errand pop up scheduled. My wife said I had to take care of something and, you know how it is, guys. You just, honey-do, that's what it is. Honey-do lists. Okay? I'm not exempt from it. So I wanted to keep the stop loss above the high up here. I didn't want to do anything with it and just let it go and try to get an attempt to get down to event horizon, then roll the stop just above this. Pool of liquidity and then maybe see if I can get that, or get stopped out, still in close proximity to 24,892.5 and that would have been enough, you know for, you know, government work. But I had to close it. I showed you on rather X, I logged in X, posted the video of me closing the position saying, yeah, I can't manage it right now. You can see where my stop loss was, you can see where the levels were, what I was aiming for. I had a limit order down here and I'm telling you how I would have managed it. And it wasn't until it got back up into this buy-side on balance, sell-side inefficiency. Now post New York Lunch, again, same thing here. Here is 1:30 Eastern Time. And what is it doing? It's trading right up into that gap that becomes inversion, fair value gap. And then it dives right down into what's what's this candlestick's low right here? Look at that price. 24,873.75. This price comes in. Hold on here. 24,873 and a quarter.
[18:02]So it's slightly higher but it's drawing towards that midpoint. Okay? And since then we just been just meandering back inside of Tuesday's regular trading hours, opening range gap. So I was not able to take this. I was commuting back to the house and the sell side below here. It's just it was so obvious, so many, so many lows there, just kept uh presenting itself.
[18:37]And if you look at price like this, okay? What do you see? What is that you see here? Take this wick out for a moment, okay? Just imagine that wick is not there. Do you see original consolidation? Accumulation, reaccumulation. Smart money reversal. Low-risk sell. First stage distribution. Second stage distribution. And a rarity when it affords it, it'll give you one more distribution to take out the original consolidation to a level I told you it was going to go to. Now, I already outlined in this lecture what this is, okay? It's yesterday's New York Lunch when it ran buy-side. When the buy-side is taken, you look for the inefficiency right before the liquidity is taken. That's how you're picking it. You're not picking the fair value gap right before that one, because it's one slightly one candle before that one I highlighted. You're picking the one that's formed right before the liquidity is taken. Because it's part of a complex reversal, part of a macro time. It's during a New York session, lunch, yesterday. And it's happening at a time when reversals take place. So instead of looking at classic support and resistance ideas, which is what I do not do, I'm going in and I'm finding exactly what the algorithm is going to go right back up to that re-price and that's the end of the show after that. Then lower, lower, lower, lower. So if we look at the uh executions, I'm inside that fair value gap right here.
[20:42]There, on the down close candle. So it went up and on the way down, I'm shorting it. Okay, on the way down. No heat. Zero heat. Nada, none, zilch. Trades down, goes into the inversion fair value gap, sells off and then I'm trading. Watch. Look close. Look right ends out. Ready? And, poof. See that? Look at that. Look, look at that, what a guy. That guy, ICT, he gets really lucky around here. He gets so lucky all the time, son of a b*tch. It runs and drops back down into Tuesday, Tuesday, regular trading hours, opening range gap. And I'm getting right at the high, see that? Perfect. See that? Perfect. Not some random, a bunch of arrows all over the place. You have no idea why they're doing what they're doing. Okay? I teach a I teach a theory, I teach you a concept, I teach you a structure, I teach you algorithmic principles. How to get in, how to get out. Okay? You're seeing my executions exactly on that premise. Not willy-nilly stuff, not some, well, I hope it I hope I can chase price up here or chase price down here. No, I know exactly what I'm looking for. Like a highly trained sniper. Okay? That's the difference. That's the difference. So, I took one of the only two contracts. Now, I I get it. I get it, dude. Bro, you're brand new, you haven't been around here for a while and you're looking up here and you're saying, dude, it's a micro. It's only $2 a point. Why don't you trade size? Because I'm teaching people that don't have a lot of money that you can do well with just one micro. Just one micro. And now I'm showing you once you get to the point where you can afford to have one more micro in your trading, this is how you can apply it. Now, the market trades down, goes just below the liquidity pool at uh 24,892.5 by going to 892 even. So it technically goes below that low. I wanted to see it go down to at least event horizon between the next pool of liquidity here and here. I wanted to see that. But you watched me close the trade out and it's trading right here at near the low of Tuesday's regular trading hours, opening range gap. Okay? After that, them's the breaks. No other executions that I can, you know, attribute to, hey, I did something wonderful. I stuck to the things I told you I was going to do today. I'm not looking for um I personally not looking for longs. I I'd rather look for shorts because I I think they're going to let it release and it's going to happen where it's just totally unexpected. It's going to be a sudden type thing. So I'd rather be hunting those scenarios where I can hopefully catch that tiger by the tail when it starts ripping and running. The only problem is, and this is the the thing I mentioned today, why I get questioned all the time, why do I believe that the market's being held in consolidation? Like, what's making it so hard to move out of that big daily range. If you do some research, you'll see that there is a historic holding of put options right now on stocks and stock index futures. So what is what is the the majority betting on? Think about that analogy I talked about before on the riverboat casinos in the old days going up and down the Mississippi River. The roulette table would be rigged and they had three paddles that were ran by magnets. And inside the ball would be a polarized magnet, north or south, doesn't matter which one it was. But underneath the numbers on the wheel, there would be paddles that would be electronically driven. And the operator at the table would put his foot on the pedal for black. If he wanted to make sure black came up. So the magnets would come up making sure that everything but the uh the black would have a same polarity as the ball that would go around the wheel. So when the when the ball finally settles, it can only fall into a number slot that allows it to. So if there's a magnet on every other number including green, you're not looking for these types of things, but that's how it was rigged. It would fall in what the majority would be as it as the take or the profit for the operator or the casino. Okay? The riverboat casino would would make the majority of the money on the table. So that's what they do, they they they rig it in a way where somebody's going to win. And that's what gets people betting. So the operator needs to go through and scan across the table and get a feel for how much money is on the table being bet. And the majority of, if it's red or black, he's going to make it come where it's the outcome. It's beneficial for the house to get the majority. But if he can't, or she can't determine what that amount of money is, all they have to do is make green come up and he they get to take both red and black off the table. So it kind of like breaks them. So I said all that really to just kind of like build the idea that I think what they're doing is is they're holding the stock market up because there's a lot of people that would be making lots and lots of money. Holding heavy short positions because they think it's Armageddon financially, everything's going to collapse and I believe that's going to happen eventually. But right now, they got to get through option expiration, okay? And I think what will happen is we'll probably see markets start to loosen up a little bit more after triple witching. And triple witching is usually when the contract expires, there's a whole lot of release and rollover going into the next month, but you also see a little bit more price action smoothing. So I think that's what we're we're waiting for. And uh until that happens, we'll probably going to have to stay in this range. And then it'll be interesting to see also with uh with silver does because I'm really I'm really watching that one. Not because I'm trading it, I don't want to be in it. But I I'm a little suspicious as to what's going to happen in that particular market. If you've been following it any like to time or listen to the trader roundup spaces, you you kind of know what I'm expecting there, okay? So hopefully you found this one insightful. Hopefully it gets your gears going. Go back through your old price action and look at that 2-hour lunch period. And when there is a turtle soup short or long, find that first fair value gap right before the liquidity is taken. Carry that over to the next day. If it trades up in there, you're going to get many times the high or low of the day. Don't take my word for it. Till next time, wish you good luck and good trading.


