[0:00]The orb strategy is currently one of the most popular trading methods for day traders because it offers an easy trade setup every single day of the week, and this works with any asset that you might trade. But whilst it's one of the most popular strategies, there are some very common mistakes that traders make when using it. So in this video, we are going to break down everything you need to know about the orb breakout strategy, and how you can also combine it with smart money concepts to find the highest probability entries for your setups.
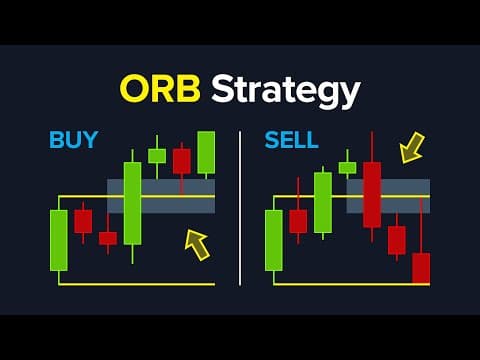
[0:26]So let's waste no time and start with step number one, which covers what the orb trading strategy actually is, and how we locate it on a chart. When people talk about trading the orb, they're referring to the abbreviation that stands for the opening range breakout. And as the name implies, this strategy involves trading the breakout of a range, but in terms of which range. We aren't talking about using the current external range liquidity levels. And this is because the range that is used for the orb strategy is found from one single candle, but more specifically, the first candle that is created after a new market session has opened. So let's explain how this works. One of the first things a trader learns about are market sessions, which are the hours during each day that the markets are open for trading within each region across the world. And the three main sessions consist of the London session, the New York session, and the Tokyo session. And whilst the orb strategy can work with any of these sessions, the New York session is by far the most favored to use for this strategy due to the higher volume of liquidity that is injected into the market during these hours. So this is the session we are going to use in this video, but if you were to trade using another session, the method for trading the orb strategy would be the same. So now with the New York session highlighted, in terms of which candle we want to use for our orb range, we actually want to wait until the New York Stock Exchange opens at 9:30 a.m. And then all we need to do is sit back and let the first candle play out because once this very first candle has closed, we will have our orb candle. And then in terms of marking out the range, we want to mark out our levels from the top and bottom wick, and then the area within these levels is the range of the orb candle. But now you might be wondering which time frame we should be using to target this candle. But this is where you have a few choices, depending on your personal trading style. And this is because, whilst we always use the first candle that forms after the 9:30 open, there are a handful of different orb ranges to choose from, based on which time frame you actually pick. For example, this candle here on the left is the first 30 minute candle, which would give us the 30 minute orb range. But on the other hand, if we chose to use the first candle of the 15 minute time frame, this would give us the 15 minute orb range instead. Then the same applies for the five minute time frame too, the first candle would give us the five minute orb. And as you can see, the main difference between using the orb on different time frames is the size of the ranges. The 30 minute time frame tends to have a much wider spread, whereas the five minute range is usually very small, which is why the 15 minute orb is the most popular among traders. Due to its balance of risk and reliability. So this is the time frame we will use in our examples, but in terms of strategy, the method for trading the orb would be the same on any time frame. So now that we have covered how we identify the orb, let's move on to the next step, which breaks down how we can actually use it for finding trade setups. So as we mentioned before, the first part for identifying the orb range involves waiting for the 9:30 U.S. stock market to open, and then we wait for the close of the first candle. And in this example, we are wanting to use the 15 minute orb range, which means this candle is the first 15 minute candle that formed after the 9:30 open. And once we have correctly identified this candle, all we do from here is draw out a level from the end of the top wick, which gives us what we call the orb range high. And then another level from the bottom wick, which gives us our orb range low, and this is all that we need to do for finding our orb range. So now we can move down into the one minute time frame to get a better look at the market structure. And when we mention using the one minute time frame, it should go without saying that trading the orb range is considered a scalping method, which involves fast paced trades that aren't lasting for too long of a period. But the benefit is that the orb can offer great trading opportunities at the same time of the day, every day of the week. So now in terms of how the orb range works, we treat the orb range high and the orb range low as support and resistance levels. And the idea behind this is that by analyzing how the market interacts with these levels, it can offer us signals for determining which direction the market intends to move next. But there are actually a variety of different strategies and setups that can be used from just these two levels. So let's start with the first strategy, which involves trading a breakout of the orb range. And as the name would imply, this strategy involves waiting for the price action to break through either the orb range high or the orb range low. But the important detail here is that we are wanting to see the candle actually close over the level. Because if the candle just wicks above it, this isn't considered a breakout. So in the instance that we have a candle that is closed over the level, and we can confirm a breakout has occurred, this is where there are now three different options for how you could potentially look for a trade entry. The first option involves taking an entry as soon as this candle has closed because this suggests that the market is looking to move further in that direction. And whilst this will make sure that you don't miss any breakout trades, the problem is that it's extremely common for false breakouts to occur, which is when the price simply just pulls back into the range. And if you're using a sensible stop loss, this would just close your trade early, which obviously isn't ideal. So this leads us onto the next entry option, which involves waiting for the market to push back down to the orb range for a retest to see whether the resistance level will now be respected as support. And if it seems as though the market is respecting the level, this offers another opportunity to enter into a long trade. And then as for the third option, you could wait for the retest to play out, followed by waiting to see if the next move manages to push up and break past the previous high that was created during the first breakout move. And the idea behind this is that it would confirm that the breakout of the orb range is legitimate and a further move up can be expected. But then the issue with this is that your trade entry is now much further away from the orb range, which isn't ideal for risk management. So in terms of trading an orb range breakout, these are the three popular methods, and each have their benefits and disadvantages as we mentioned. But for our preference, we like to use the second option, which involves trading the retest of the orb, and the reason behind why is because it allows us to incorporate smart money concepts to find setups that offer a much higher probability. But before we explain how we can do that, it's worth just mentioning that in these examples, we have shown the breakout of the orb range high. But if the market was to instead break through the orb range low, the whole process would be just the same, but it would instead be inverted, which in simple terms, means we would be looking for a breakout to the downside instead of the upside. So with that covered, let's now move on to the next step, where we can look at how we can incorporate smart money concepts into our orb trading strategies. So as usual, we are again going to use the 15 minute orb, which is the first 15 minute candle that formed after the 9:30 open. But this time, we are going to instead move down only one time frame to the five minute chart. And then we are going to move forward in time till a breakout occurs, which it didn't take long to do. But now if we are wishing to incorporate smart money concepts into our orb trading strategy, we are of course, going to want to look for P.D. arrays that are able to strengthen the potential of our breakout setup. And this chart gives us a great example because during this impulsive move that broke up and through the orb range high, we can see that a bullish fair value gap was created. And what this means is that we now have a bullish P.D. array that is overlapping with our orb breakout, which justifies our bias for looking for a long trade. And going back to what we mentioned earlier, out of the three options we can choose between for trading a breakout, if we were to use the FBG as a target for our entry, it would involve using the second option, which would be to wait for a retest of the orb level. So to show what this looks like, the market pushes down and into the FBG, and then briefly touched the orb level before then rejecting back into the upward direction, which means in this case, the FBG was respected, whilst also creating a retest of the orb range. But the markets are not likely to always make moves as clean as this one. And this is because when it comes to fair value gaps, we know that there are times when an FBG might barely be touched before the price reverses. Whereas other times, the whole fair value gap might be attacked, which would mean that the market would actually be over extending past the orb range level. But the point is, all three of these examples are valid rejections, and the strength of having two different arrays overlapping each other is what makes these setups higher probability. However, if the market was to push past the orb range level to then close below the fair value gap, this is when the setup would become invalidated, which is why it's always important to keep a tight stop loss for a trade like this. So as for this five minute setup we were looking at before, we can move down into the one minute time frame to take a look at its market structure. And the thing worth mentioning here is that if we look closely, there was actually a one minute fair value gap that formed during the breakout of the orb range. But the issue with this is that a one minute P.D. array is just too small of a time frame to trust. Some people do use them, but to find higher probability trades, you should try to filter for higher time frame setups with the minimum being the five or 15 minute time frames for P.D. arrays. But trading breakouts isn't the only type of strategy that the orb can offer us, which moves us onto the next step, which involves understanding how to use false breakouts to your advantage. So here we have another example of a 15 minute orb. And just from a quick glance, you should be able to see that this is an example of a false breakout, because during the second candle, we can see a long top wick, which tells us that at some point during the candle's duration, it had actually broken through the orb range high. But by the time the candle had closed, it was back within the range of the orb. And this might not seem like it means much, but depending on what happened during this failed breakout, there could actually be a potential trade setup. And in order to see how, we must move down to the five minute time frame. So now looking at the market structure on this lower time frame, we can see where the orb range was created, which was during the first three candles. And then we can also see where the false breakout occurred, as well as where the market fell back inside the range. But when observing the market structure for P.D. arrays, we can see that during the pullback move, a bearish fair value gap was created, which also happened to overlap with the orb range level. And this is useful to us because in the same way that we can use a bullish fair value gap that overlaps with the orb level for a bullish setup, we can also use bearish fair value gaps to trade the orb level as an area of resistance. And in terms of how we would look to trade a setup like this, it would again involve a retest of the orb level. But this time, we are going to want to take a short entry from the bearish fair value gap, with the theory being that if the orb range high is currently being respected as an area of resistance, it's likely that the next move that we will see will be the market pushing further down. Which essentially means that whether the market creates a breakout or a false breakout, in both cases, there are opportunities for trade setups to occur. And another interesting observation for this type of false breakout setup is that if we move back to the 15 minute time frame, you might have noticed that this market structure has created a CRT setup. Which is another trading method that you can use to identify the rejection of a breakout, which we have already covered in another video. So with that said, we now need to move on to the next step, which involves understanding what external levels and market structures you must be aware of when trading the orb, which is where most traders make mistakes when using this strategy. So here we have another example of a 15 minute orb, and when we move forward a few candles, we can see what seems to be a great example of a breakout. But the problem is, when we move up to a higher time frame and zoom out to look at the external market structure, we can see that the market price of this current candle is attacking the previous day's high. And the reason why this is something to be aware of is because as we know, the highs and lows of previous daily candles are liquidity areas that the market routinely likes to target. And whilst it doesn't necessarily mean that the market will reverse when it hits this level, the point is that it needs to be treated as an area of interest with caution for the possible outcomes that could occur. Because in this example, when we move forward in time, after the market pushed up to attack the previous daily high, instead of continuing higher, it creates a liquidity sweep before then making a complete nose dive. And if it were the case that we were currently in a long trade, this is exactly the type of scenario that we would want to avoid. And to show how, if we now go back down to the 15 minute time frame to take a look at how this move played out, we can see that whilst the orb candle was originally respected, the draw on liquidity was the previous day's high, which meant that when that level was hit, it completely invalidated this setup on the lower time frame. And this isn't the only type of P.D. array you need to be aware of on the chart. There's a whole list of higher time frame P.D. arrays that can affect your orb trading setups. Some will benefit your setups, whilst others will invalidate them, and we have already made videos that cover each of these on the channel. But the important thing to understand here is that when it comes to trading the orb, it should only be treated as a tool for observing the immediate directional market bias after a new market session has opened. Which means you still need to incorporate the rest of your SMC analysis into your trade setups. But with that said, it is still a very strong strategy to use when used correctly. We are currently building a TradingView indicator for the orb strategies in this video, as well as all of the other smart money concept strategies that we have already covered on the channel. So if you want to try it out, there will be links for everything in the description, and if you found this video helpful, please leave a like and then comment what trading concept you'd like to see us cover next.


