[0:00]Most traders look at candlesticks like random bars on a chart. Bullish candle, bearish candle, maybe a nice looking wick, maybe some candlestick pattern they memorized from YouTube. But the truth is, not every candlestick matters equally. Sometimes, one single candle give you the entire framework for the next move. It can show you where liquidity is sitting, where price is likely to react, and whether the move you're seeing is the real move, or is just a trap. In this video, I'm going to break down Candle Range Theory in a much simpler way. And I'm going to show you how to actually use it properly. Where to find the best CRT candles, how to know if the liquidity sweep is actually valid, and where real entry comes from. My name is Brad Goh. I've been trading for 7 years. To date, I've made over 3 million dollars in trading profits, and every single trade is documented live on my second channel, Brad Trades. I've also helped hundreds of students become 6-figure funded traders. And I'm also the founder of EdgeFlo, which is a disciplined first trading platform which allows you to trade with structure before, during and after you trade. So, quite simply put, I don't want your money. I just want you to become a better trader. Let's get into it. Now, first of all, before we talk about what to do, let's talk about what not to do. And what not to do is to trade like majority of the retail traders out there. Because if you trade like the majority of the retail traders out there, you're just going to get the same results as the majority, which is losses upon losses. And what majority of the retail traders do when they are trading candlestick patterns is that they are focusing on too much candlestick shapes and patterns and names and nuances, right? Oh, if I see this pattern it's going to do this. If I see that pattern it's going to do that. And as a result, they treat every candlestick equally. But the thing is, not every candle matters the same. Every single candle actually tells us a story. All you have to do is to listen. The real question is, which candle is price actually respecting? That's the candle that we want to focus on. Everything else is just noise. So, what the hell is CRT actually? CRT stands for Candlestick Range Theory. I don't know why I put a candlestick right there. Let me just cross out the stick. So it's Candle Range Theory. And basically you must understand the anatomy of a candlestick. Every single candlestick has a high and a low. There's the highest point that price went to when the candlestick is being formed, and then there's the lowest point that price went to while the candlestick is being formed, right? So this is your candlestick high and this is your candlestick low. Which also means that technically every candle creates a range, right? Because we've got a higher, we've got a lower here, and this becomes the range which governed the entire candlestick. And CRT is about using that candle's range as the framework for reading price. So what we do in CRT is that we actually use the high and the low as key levels to know whether price is actually respecting or breaking past those levels. So we know whether price is reversing or continuing. So in this example right here, let's say this is the higher time frame screenshot, right? This is what price looks like on, let's say the 4-hour time frame. If you go down to the lower time frame, you break this entire candlestick pattern down and you go and look at it in with like a microscope, right? On maybe, let's say, the 1-hour time frame, which is the lower time frame, or the 15-minute time frame, this is what it's going to look like.
[3:44]Okay? So this is just a fractal view of what's actually going on on the higher time frame itself. And realize that the high and the lows, these are literally the turning points. Okay? So, price pretty much went up to the candlestick high that we have established, reversed, and right now price is approaching the candlestick low, which means that it's potentially about to reverse as well. So, once again, the high and the low of a particular candlestick essentially acts as liquidity boundaries. And when price revisits the range, it can either accept beyond it or reject beyond it. And this right here is pretty much the concept of order flow, which says that when price want to move, it often goes through this entire cycle of accumulation, manipulation, and distribution. This is where, you know, maybe the institution are actually accumulating orders, stacking a large amount of buy orders, and then later it purposely push price all the way up here, right? Manipulate price, shipping some liquidity, grabbing some liquidity, so that they can actually have the liquidity that is needed to actually fulfill their opposing sell orders, right? Which is what allow price to actually get manipulated, and then later to continue to the downside, right? Continue the the entire real move. So, accumulation, manipulation, and distribution. And if you apply that into Candle Range Theory, you will see that when price is sweeping the liquidity above the candlestick high, or below the candlestick low, this is where the manipulation phase is going on. Okay? So, if you don't understand what I mean, basically, if price goes up there and sweep one side of the candlestick range, and closes back inside the range just like this, forming like a V-shape reaction, causing like a false breakout, this means that this move right here is just a liquidity grab.
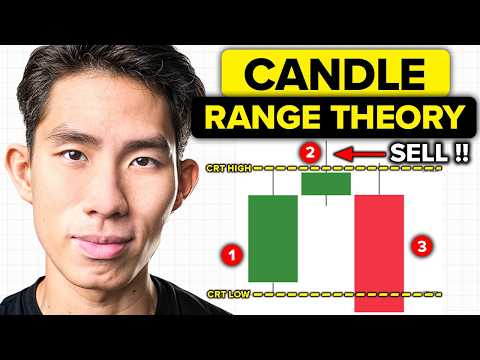
[5:33]This right here is just a liquidity sweep. And then after this has happened, price is most likely going to move towards the opposite side of the range, which is the candlestick low, or continue in the direction of the higher time frame trend. So, CRT is really about reading the range, the sweep and the real intention of price. All right, cool. Now, let's go on to the charts and try to spot some good old CRT. But before you do, you must understand where to spot them. Because if you apply this Candle Range Theory, you will see it everywhere, because every single time frame, every single market, every single whatever, there is going to be some form of candlestick patterns, which also means that if you don't know how to apply this CRT theory properly, what happens is that you are going to be lost and overwhelmed. Right? You're going to be trying to spot the high and low of every single candle whatsoever. And you must understand that just because a candlestick is building up right now, a candlestick is forming right now, does not necessarily mean that we want to apply this concept to that particular candlestick. We only want to apply it to CRT candles, right? And where do you find the CRT candles? You find it at higher time frame point of interest. I'm talking about some form of supply and demand zone, order blocks, support and resistance levels, previous swing high or swing low, right? Basically key levels. Okay? Those are the candlestick where you want to pay attention to. Because price tends to reverse at those key levels, and that is where you can use the Candle Range Theory to kind of give you an indicator or signal that price is potentially going to reverse soon. And you can also look for CRT setups in premium and discount areas. So in an uptrend, I ideally you want to look for bullish CRT setups in discount. In a downtrend, you want to look for bearish CRTs in the premium. And also another place would probably be at the end of a correction, right? So if the market is trending right now, this is where you can expect price to pull back to like a meaningful area before continue going down. And this is where you might want to find the CRT candle right here inside the pullback to give you a confirmation that price is actually continue with the higher time frame trend. And also another place that comes to mind is probably liquidity zones, right? So I'm talking about above equal high, below equal lows, right? Obvious buy-side, sell-side liquidity, and prior session highs and lows. Now, once again, I'm not going to go too deep into each one of these concept like supply and demand zone, order blocks and liquidity concepts because I've already done a video covering each one of these concept, so you can just go to my YouTube channel and just search it up and you will be able to find it easily. What I really do want to go through in this video is the CRT. Now, looking at this example right here, price has been heavily bearish, but recently price actually reversed, which indicated that potentially there was some buyers, some demand at this price point, causing price to actually go up. If that's the case, this is where we can mark this as our low, and this is where there is some form of demand zone within this area right here. So, now, since there's demand sitting at this 1.536 price point, we are pretty much expecting some buyers in the market to actually cause price to push up. And this is where I'm going to get interested in the CRT, right? This is where I'm going to look for my CRT candles to tell me, okay, price is potentially going to reverse, right? CRT is always going to be the first sign of reversal. So, over here, this is the most recent candle, right? So, this is where our markup the high and the low of the candlestick just like this. You let me just zoom in for you guys to see. Okay? So, price is at the demand zone, and we are on the 15-minute time frame, and we have marked up the candlestick high and also the candlestick low, right? So, this is a CRT high and CRT low. Now, bear in mind that you can apply this theory, this concept across all time frames, right? Whether that's 1-hour, 4-hour, or whatever. It's universal because candlesticks is candlesticks. We love all shapes and sizes, you know what I'm saying? So yeah, that's the CRT high and low. Once that's done, then the next thing we want to look out for is for price to actually sweep either the high or the low, right? Remember your manipulation phase, right? We need to see that sweep, and then if price get that sweep, then potentially we are we can trade it in the opposite direction to the the opposing end of the range. So, in this case, since price have not swept, let me just not do anything. Let's see what price does next. Okay, you can see price came down, swept the candle range low. So, at this point of time, this is where we want to go down to the lower time frame to look for our entries, right? So, for this example, I'm going to keep things simple and just use two time frames, the higher time frame, which is the 15-minute, which is the one that we are using to mark up the candle range, and the 5-minute is the time frame that we're going to be using for entries, right? To look for our entry confirmation and trigger. So, this is where the minute price actually swept the low or the high of the entire candle range, I will drop down to the lower time frame. Okay? So, listen up. Very, very important. You do not drop down to the lower time frame until either the high or the low get taken out. Because sometimes what can potentially happen is that after this candle is formed, there is no liquidity sweep. Right? So, as a result, price just continue consolidating in this area right here, before we get the actual liquidity sweep. So, you want to be mindful and take into account of the fact that every single pattern in the market is different, right? Every single moment in the market is unique. Which means that price might not give you this perfect price action, textbook price action all the time. But anyway, this is where we go down to the lower time frame since price has already swept the low. Okay, cool. So, now that we are on the lower time frame, we saw that clear as day, this is where sellers tried to push the price down, but they failed. Right? As a result, demand actually overpower supply, causing this huge bullish candlestick right here, sweeping the liquidity below these lows right here, and causing price to reverse. This is where you can potentially look for longs. If you look for longs right here, this is where you want to be targeting the opposing end of the range. Right? So, if you're entering for a buy at a Candlestick Range Theory low, you're going to be targeting the Candlestick Range Theory high. If you are selling at a candlestick range high, then you are going to be targeting the candlestick range low. Right? So, always target the opposing end. Okay? Yeah, so, this is the aggressive version of the entry model. I'm going to share with you the conservative version later on, but for now, just know that if you are super, duper aggressive, right? You are risk seeking. This is where after price have swept the range high or low, you can immediately enter upon seeing some form of confirmation in terms of liquidity sweep. So, ideally what I want to see to confirm that this is indeed a valid liquidity sweep is, first of all, the V-shape reaction. Second of all, is some form of bullish candlestick just like this, to confirm to me that demand is actually present in the market, and I'm not delusional. Okay? But yeah, this is the confirmation for aggressive entry. So once you see that you can easily enter for longs right here, and this is where you can place your stop loss below the liquidation candle, or below the candle range low. Right? For me personally, I like to be safe. I'll place it below the liquidation candle, which is pretty much the candlestick that swept the liquidity, right? Which is this one right here. Came all the way down here. This is the lowest point. Right? So, this is like where the liquidity sweep actually happened, and I'll place it a few pips below it. And this is where I'll target the opposing end, which is like somewhere right around here, and you just like set and forget and you just let the trade do its thing. Right? So, low and behold, within 10 minutes we are off the trade as simple as that. As simple as that. Just to keep things mechanical for now. Now, once again, I'm not going to dive too deep into how to, you know, get like insane sniper entries in this video, because I've done a lot of videos on that, right? You guys can go and watch the other videos. In this video, I really just want to like dive deep into the CRT and how to actually trade it properly. So, that's the aggressive entry model. But the thing is not everybody is so risk-seeking, right? Because sometimes what can happen is that price can do this and then still continue going down. So, as a result, you might want to use the conservative version of the entry model. Which one should I use? It depends on you. It depends on your risk tolerance, depends on your trading style, depends on your trading plan, and most importantly, it depends on your data. So, if you are testing out this new concept, try both aggressive and conservative entry model and see which one works best for you and then you want to stick to that one. But anyways, next up, let's talk about the conservative entry model. So, what I've just shown you is the aggressive version, right? Which means we enter right after the liquidity sweep just like this and target the next high. Okay, the conservative version entry model, which is for people who are more risk averse, requires you to wait for extra confirmation. Okay? What do I mean by extra confirmation? Well, extra confirmation in terms of a retracement, of a pullback. Which means that after this liquidity sweep has happened, we want to see price ideally pull back to some form of point of interest right here, then you look for longs. Okay? So, this is the extra confirmation that you need in a conservative version of the entry model. So, you can either wait for price to pull back to the demand zone that swept liquidity, which is this entire zone right here. Right? You can just mark up the entire liquidation candle from high to low, just like this. This would be the demand zone that swept liquidity. So, you're expecting price to pull back to this area, and then this is where you look for longs and trade it to the upside. Or another point of interest that you can look out for is the imbalance that was created. Okay? So, imbalance is basically the gap. Right? So, if you look at this huge candlestick right here, what do we have? We got a huge gap right here. Okay? Which is demarcated by the previous candlestick high the high and the next candlestick low just like this, creating a gap, and this is what we call imbalance. And this is also another point of interest where price tend to respect before pushing to the upside. So, in this case, this is where you can enter for a long position on either the imbalance, or the extreme point of interest. The pros of entering upon the imbalance is that most of the time price tends to pull back to the imbalance and then blast off. But the con of entering at the imbalance is that there's a chance that it's a little bit too aggressive and price can potentially make a deeper pullback into the extreme point of interest and then push it to the upside. Okay? So, I'm just going to give you the raw truth. You got to find out which one works best for you based on data. Yeah, so, in this case, let's say we enter at the imbalance right here. So, we wait for price to actually mitigate the imbalance. Once that actually happens, you enter upon the imbalance just like this, and this is where you can place your take profit at like 3R, 4R, or however you like to place your take profit. But once again, to keep it simple, we're just going to place it at like, let's say, 3R in this particular lesson itself. Right? So, just stick to 3R. So, you can see what happened is that price mitigated this imbalance, and then went up there, smash your take profit as fast as humanly possible. So, that's the conservative entry model. Now, let's go through another example, this time on NQ and in an uptrend. So, in an uptrend, we want to see our CRT that tell us that price is reversing to the downside. If that happens, this means that price is potentially going to start pulling back or is potentially going to start a huge reversal to the downside. So, over here we got price went up, pull back, and then goes up. Okay? So, price has literally just broke structure. And when price has just broke structure, we are anticipating price to start pulling back. How do you know when price is going to pull back? Well, you look for the Candle Range Theory. Okay? So, this is where we spot that this is the most recent candle. This is where you can mark up your candle range low and candle range high just like this. Okay? High, low, marked up. Very, very cool. Now, what do we do? We do nothing. Remember, waiting is the best position in trading. Not buy, not sell, but waiting. Okay? So, you do nothing until either the high or low get taken out. So, I'm over here chilling. Boom, price swept the high. Okay? This is where I'm getting interested. I'm getting intrigued. So, I go down to the 5-minute time frame, which is my lower time frame to look for my entries. So, once again, at this point of time, if you are aggressive, you can enter right after the liquidity sweep. Okay? So, the minute price actually swept liquidity just like this, you know, it went up there and take out the previous candlestick high, gave us a long wick just like this to indicate to us that there is indeed a liquidity sweep. Because what this essentially means is that at some point of time, buyers tried to push price all the way up here. But then there was just too many damn sellers in the market, causing price to come all the way down here, creating this huge selling pressure and causing the candlestick to close bearish just like this. So, that right there is clear as day, liquidity sweep. So, if you're aggressive, enter for a short right here. Place your stop loss above the CRT candle just like this. Right? Above the high of the the liquidation candle. Sorry, not the CRT candle. Right? You can either place your stop loss above the high of the liquidation candle, or you can place your stop loss above the high of the CRT high. Right? But my personal recommendation is to place it above the liquidation candle. Above the high of the liquidation candle. Reason being, this right here has just become a protected high, which also means that price is most likely going to respect that high the next time you actually pull back to the area. Because time and time of again I've seen people place their stop loss above the CRT high just like this, later on price make a tiny little pull back, stop them out, and then later on price went in the way. Yeah, you can see just for price to go in the way later on. So, this would be like an epic fail. Okay? If you actually like did not know where to place the stop loss properly. But I've just given you the secret sauce. Right? So, stick to the stop loss placement.
[20:43]Make sure you place it at a price point which invalidate your trade idea. And to me, that's the liquidation candle. Now, cool. Let's talk about the conservative version of the entry model in this case. So, the conservative version of the entry model in this case, remember, after the liquidation candle, this is where we can see that, okay, this is the entire liquidation candle. You can mark this as your supply zone, right? Your supply zone that swept liquidity. So, we are not doing anything until price mitigate that supply zone that swept liquidity. So, this is where, just nice, the next candle actually mitigated that supply zone that swept liquidity. Right? So, you can potentially place like a limit order. Right? So that upon the mitigation of the supply zone, you are tap into the trade and you can target this high, this low right here, or you can target like the the next 2R, 3R. Once again, however you actually manage your trade properly. But if you do this, always make sure you place your stop loss a few pips above this high, giving it a little bit of breathing room. Yeah, so, I'll say like, once again, I'm going to leave it completely up to you to choose like which entry model do you want to be using, right? Because both of them works. It just depends on how good you are at using those entry models and how favorable the market conditions is. Because sometimes you use the aggressive entry model, it play out perfectly. But sometimes it doesn't because the market conditions just sucks. Right? So, there's a lot of nuances, there's a lot of variables that you need to take into account of. Right? So, I can't just sit here and just tell you, "Yo, use the aggressive entry model. That's the holy grail." Or use the conservative entry model. That's the best. It's really comes down to your data. Now, before we end here today, I just want to give you one final tip. And that is, only trade your A+ version of the Candle Range Theory. Like I say, just because a candlestick is there, does not necessarily mean that you have to trade that particular candlestick. Does not necessarily mean that you have to apply the CRT to that candlestick itself. You want to find the version, right? The CRT variation that is the cleanest, that is the most obvious, that is the most easiest for you to trade. And I always say this to my students, "A good trade idea hits you like a truck. It's so obvious it feels stupid not to take it."
[23:02]So, make sure that you're extremely selective with your trade ideas. Focus on quality over quantity. So, that, my friend, is the real way to use the CRT. Once you start seeing candlesticks as ranges, as price action, as sentiment, as institutional flow of money, instead of random patterns, the whole chart becomes a lot cleaner. And once you see it, you can't unsee it. Just like when Neo took the red pill in the Matrix, everything starts changing. Because key has changed. Now, let's be honest, this entire CRT entry model is absolutely useless if you do not combine it with my market mechanics concepts. If you do not understand where to spot these CRTs. If you do not understand how to develop a daily bias. If you don't even know how to identify liquidity, then everything that you just learned here today is useless. So, this is why I highly, highly recommend you to check out my full market mechanics playlist right here. You can get access to all my concepts for absolutely free. I just want to provide as much value as humanly possible, right? So go on, check that out right now. And as always, remember, you're just one trade away. Mwah.


